From Alerts to Action
Learn how to integrate Prometheus and Alertmanager with a Spring Boot application to detect issues and send automated notifications via Slack.
Executive Summary
In production, your application must respond immediately to issues such as HTTP 500 errors, spikes in CPU usage, or memory pressure. Relying on manual checks or logs isn’t a scalable solution. Instead, Prometheus and Alertmanager enable automated alerting that proactively detects problems and sends notifications to tools like Slack. This post explains how to configure Prometheus to scrape metrics from a Spring Boot application, set up alert rules, and use Alertmanager to dispatch Slack notifications. The full example can be found on GitHub: samsond/alerting-demo.
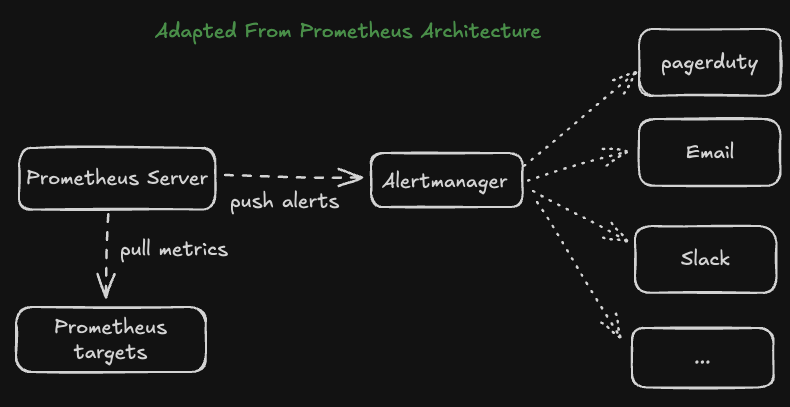
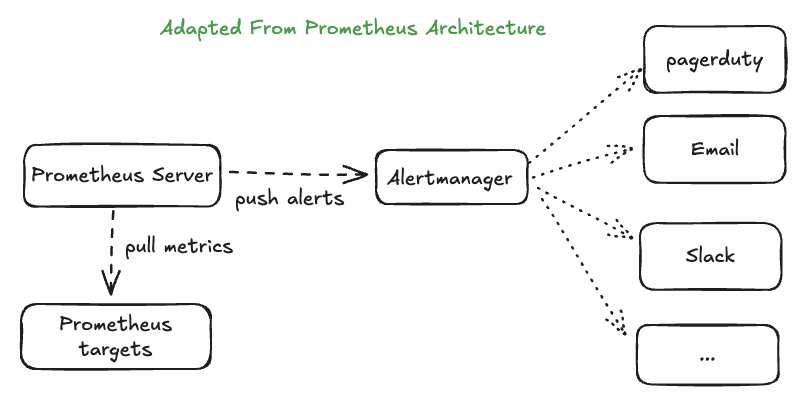 Reference: Prometheus Architecture Overview.
Why Alerting Matters
Timely, actionable alerts are critical to prevent small issues from escalating into major outages. Automated alerting ensures that the right teams receive instant notifications, drastically reducing mean time to detection (MTTD) and mean time to recovery (MTTR).
Key Alertmanager Concepts
Before diving into the hands-on configuration, it’s useful to understand how Alertmanager helps manage your alerts. Here are the fundamental features:
Routes: The core of Alertmanager’s configuration. Routes determine how alerts are grouped and where notifications are sent (e.g., Slack, email, PagerDuty).
Silences: Temporarily pause notifications for a set of alerts during maintenance windows or planned downtimes.
Inhibition Rules: Suppress certain alerts when related alerts are firing, reducing notification noise.
Notification Types: Alertmanager supports various notification services, and if a specific integration isn’t available, you can use the generic webhook.
Notification Templating: Customize the content and style of notifications by referencing alert labels and annotations.
High Availability: Run multiple Alertmanager instances to ensure continuous alert delivery, even if one instance fails.
Prometheus Configuration
Create a prometheus.yml (located at prometheus/prometheus.yml)
1
2
3
4
5
6
7
8
9
10
11
12
13
14
15
16
global:
  scrape_interval: 15s
  evaluation_interval: 15s

alerting:
  alertmanagers:
    - static_configs:
        - targets: ['alertmanager:9093']

rule_files:
  - 'alert_rules.yml'

scrape_configs:
  - job_name: 'alerting-demo'
    static_configs:
      - targets: ['alerting-demo:8080']
Key points:
- scrape_configs: Instructs Prometheus to collect metrics from your Spring Boot application on port 8080.
- rule_files: Specifies the custom alert rules file.
Alert Rules
In alert_rules.yml, define a rule to detect an excessive number of 5xx errors:
1
2
3
4
5
6
7
8
9
10
11
12
13
groups:
  - name: demo-service-alerts
    rules:
      - alert: HighCount5xxErrors
        expr: |
            sum by(path, instance, job) (
              increase(http_server_requests_seconds_count{status=~"5..",job="alerting-demo"}[1m])
            ) > 3
        for: 1m
        labels:
          severity: critical
        annotations:
          description: "The 5xx error rate for path  on  is %."
Key Points:
- increase(…[1m]) > 3: This rule triggers if more than 3 errors occur within one minute.
- for: 1m: The condition must persist for 1 minute before the alert fires.
Setting Up Slack Notifications
To receive alerts via Slack, follow these steps to configure an incoming webhook integration:
- Create a Slack channel in your Slack workspace named #alertmanager or use any channel name you prefer.
- Configure Incoming WebHooks
- Navigate to Slack’s Incoming WebHooks Apps page.
- Click the Add to Slack button.
- In the “Post to Channel” dropdown, select #alertmanager.
- Click Add Incoming WebHooks Integration.
- Copy the Webhook URL
Alertmanager Configuration
In alertmanager.yml file, set up Slack notifications:
1
2
3
4
5
6
7
8
9
10
11
12
13
route:
  receiver: 'slack-notifications'
  group_by: ['alertname']
  group_wait: 30s
  group_interval: 5m
  repeat_interval: 3h

receivers:
  - name: 'slack-notifications'
    slack_configs:
      - api_url: 'https://hooks.slack.com/services/YOUR/WEBHOOK/URL'
        channel: '#alert-channel'
        send_resolved: true
Explanations:
- route: The top-level route sends all alerts to the slack-notifications receiver.
- slack_configs: Ties in the actual Slack Webhook URL and target channel.
Replace YOUR/WEBHOOK/URL with the Slack Incoming Webhook URL you obtained during setup.
Running and Testing the Setup
To see your alerting pipeline in action, follow these steps:
Open your terminal in the project root and run:
1
 docker-compose up --build
This command builds and starts your Spring Boot application, Prometheus, and Alertmanager containers.
Once the containers are running, simulate error traffic by navigating to http://localhost:8080/api/random-error. Request the endpoint a few times to generate enough 500 errors to trigger your alert rule.
Open http://localhost:9090/alerts in your browser. You should see the HighCount5xxErrors alert marked as firing if the error count exceeds the threshold. You can also check http://localhost:9090/targets to ensure your Spring Boot app is being scraped correctly.
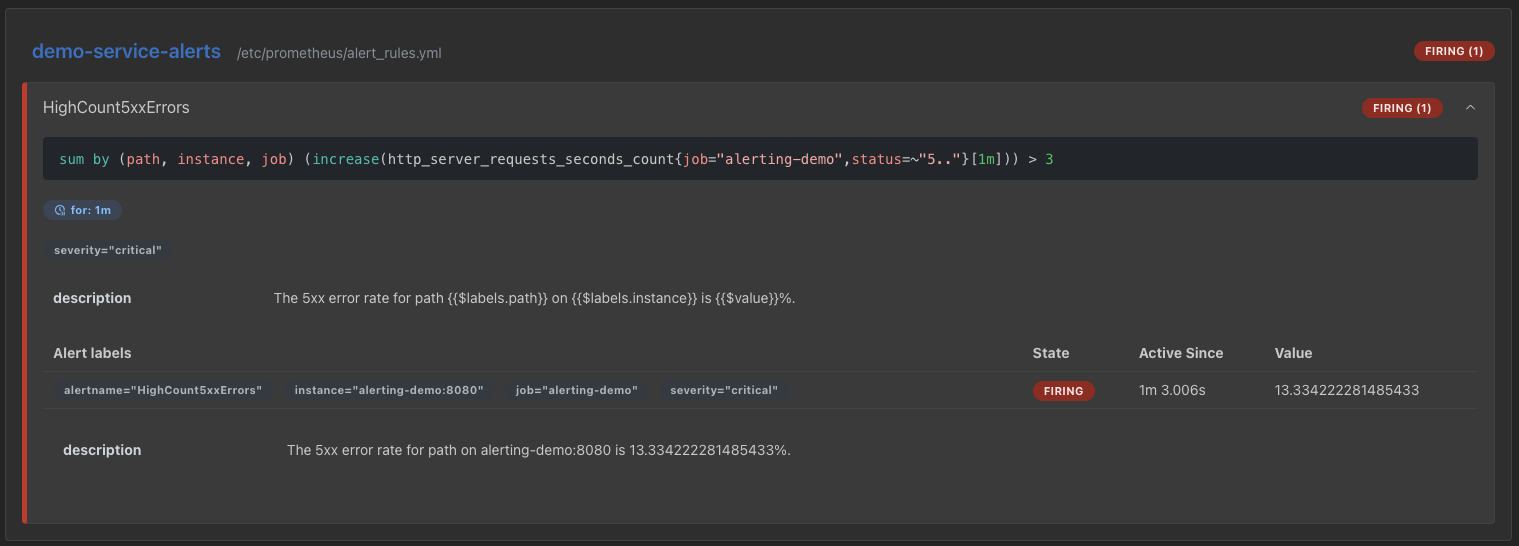 In this screenshot, Prometheus has detected more than 3 errors in the last minute and has fired the alert.
Finally, verify that a notification appears in your designated Slack channel (e.g., #alert-channel). Alertmanager will send a message according to the configuration in your alertmanager.yml.
Once you’ve confirmed that the alert fires in Prometheus and the Slack notification is delivered, your automated alerting system is working as intended!
Note: The example provided here is intentionally simple to illustrate the alerting flow, allowing us to focus on the integration setup—including Prometheus configuration, alert rule design, and Alertmanager’s routing.